

← Weekly Updates
Weekly Update: October 26, 2026
This week’s perspective on stock earnings yields, Treasury yields, and our RiskFirst® approach to investment risk.
Read this week’s client letter below, including the original chart and disclosures. Open the PDF for zoom controls, or jump to the reading text.
Open Weekly Update (PDF)Read the update text
When you buy a stock, you are buying a share of a company’s profits. One way to measure what you are paying for those profits is the earnings yield, which shows how much a company earns relative to what investors pay for its shares. This week’s chart compares the S&P 500’s earnings yield with the 10-year Treasury yield. For most of the past twenty years, stocks offered the higher yield, often by a wide margin, and that gap was part of the reward for owning them instead of bonds. Since 2023, that relationship has reversed. Today, the 10-year Treasury yield is about 1.4 percentage points higher than the S&P 500’s earnings yield, the widest gap in favor of Treasuries in more than two decades.

In plain terms, investors are paying a relatively high price for each dollar of corporate profit, and the extra reward for taking stock-market risk has largely disappeared. This does not mean that stocks are about to fall. The gap can last for years, and profits can grow into higher prices. It does mean there is less room for disappointment if corporate profits fall short of expectations. This is where our RiskFirst® approach matters: we evaluate what different investments offer relative to the risks they carry, then diversify across multiple sources of return. The goal is to be paid for risk, not just exposed to it.

First Time Since '02 Treasury Yields Have Caught Up With Stock Earnings

Sources: Bloomberg, Redwood. Data as of 10/21/2026.

Regards, Shrier Associates LLC

Disclosure: This piece is for informational purposes only and contains opinions that should not be construed as facts. Information provided herein from third parties is obtained from sources believed to be reliable, but no representation or warranty is made as to its accuracy or completeness. Charts and graphs are for illustrative purposes only. Past performance is not indicative of future results. Any indices shown are not available for investing. If there is discussion of any specific strategy, it is not intended as a guarantee of profit or loss. If objectives are mentioned, there is no guarantee that it will be achieved. RiskFirst® is a registered trademark of Redwood Investment Management, LLC.

Objectives mentioned are not guaranteed to be achieved. Associates LLC is a state registered investment adviser. Such registration does not imply that the adviser as reached a certain level of skill or ability and no inference to the contrary should be made. Please see firm’s Form ADV Part 2A (Brochure) for more information on investment risks and strategies. Redwood and Shrier Associates LLC are not affiliated entities. Consumer Price Index (CPI) measures the overall change in consumer prices based on a representative basket of goods and services over time.

619 Devenwood Way, Clinton, MA 01510 | 5 Farleigh St. Suite 305, Asheville, NC 28803

508.898.9500 | rick@shrierassociates.com | shrierassociates.com
Related Posts
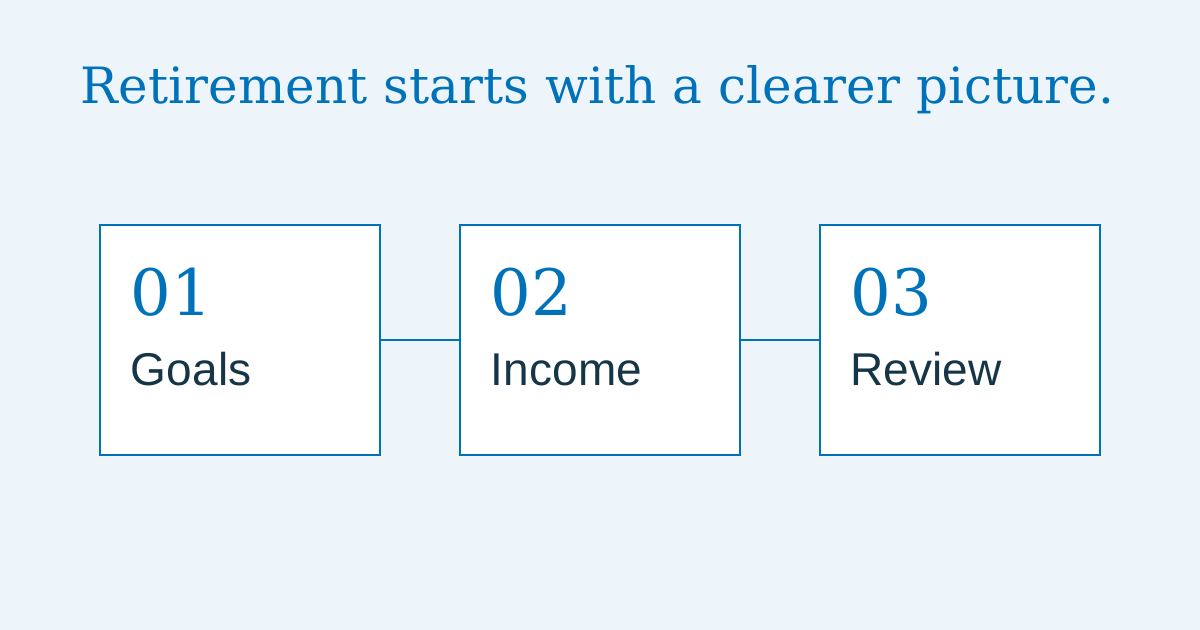
A Retirement Planning Checklist for Your Next Chapter
Organize your spending, income, healthcare questions, and investment decisions before you make the transition to retirement.
Read Article →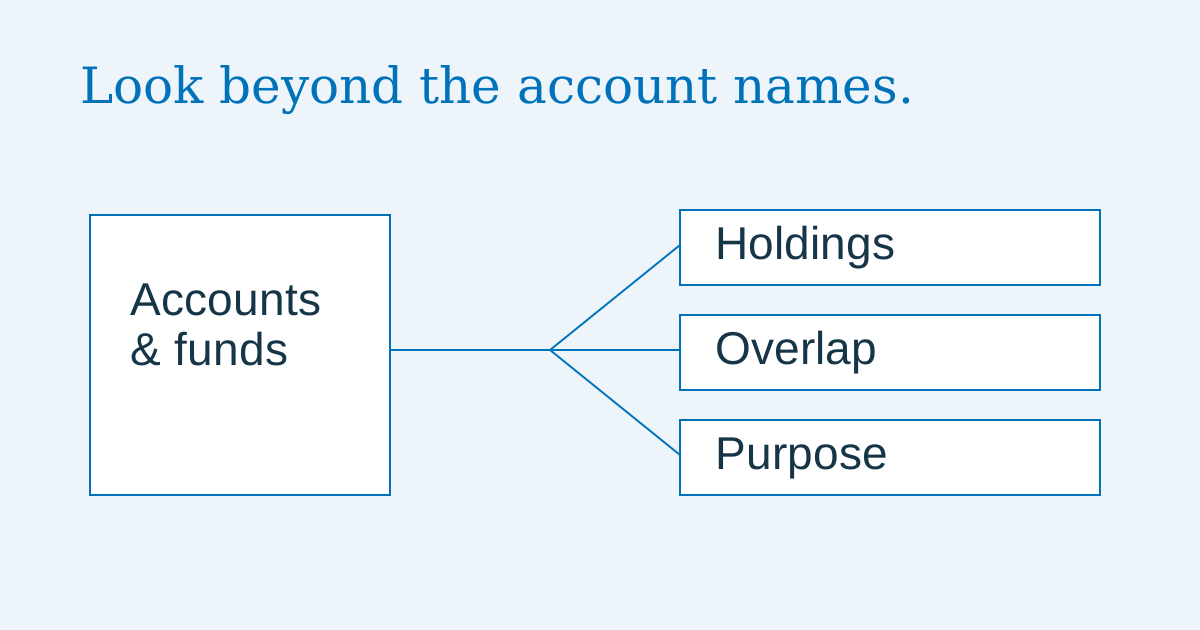
How to Review Your Investment Diversification
A step-by-step way to understand overlapping holdings, concentration, costs, and the role each investment plays in your plan.
Read Article →