


Shifting Markets, Disciplined Process: our Q3 2026 market review, ERB portfolio positioning, and RiskFirst® process.
Read the complete eight-page ERB portfolio report below, including all charts, performance information, and important disclosures. For larger text and zoom controls, open the original PDF.
Open Full Commentary (PDF)Shifting Markets,
Disciplined Process
Q3 2026 Commentary
Why Process Matters
More Than Prediction
Q3 shared similar volatility to Q1, introducing the threat of a pullback in risk assets that had been near all-time highs. In
just three quarters, investors have experienced a selloff, a sharp rally, and now a surge in interest rates. No one could
have predicted that sequence, and our RiskFirst® Process doesn’t try to. Rather than forecasting the next market move,
it is designed to keep portfolios on track across environments, with the Strategic, Defensive, and Private Real Estate Debt
sleeves each playing a defined role.
Each sleeve responded in its own way this quarter. The Strategic sleeve stayed diversified as market leadership
shifted, the Defensive strategies began reducing exposure as risks grew, and Private Real Estate Debt continued to
provide steady income. Rather than judging success by short-term results, we measure progress against a defined
range of expectations. For Q3, each model remained within its RiskAlign® range. That is the process working as
intended: keeping portfolios within their designed risk profile through a stretch when both stocks and bonds were under
pressure. By staying anchored to this discipline, we remain on track toward long-term objectives regardless of the next
quarter’s headlines.
RiskAlign® Ranges
ERB 5-8 Within Range Range ERB 8-12 Within Range Range
5-8% Drawdown Target 8-12% Drawdown Target
-8.3% 0% +10.6% -9.0% 0% +12.3%
ERB 12-17 Within Range Range ERB 17-25 Within Range Range
12-17% Drawdown Target 17-25% Drawdown Target
-10.2% 0% +14.9% -11.9% 0% +18.2%
ERB 25-35 Within Range Range
25-35% Drawdown Target
6 Month RiskAlign ® Expected Returns
(As of 3/31/2026)
-13.3% 0% +20.8%
Source: Redwood. For illustrative purposes only. Drawdown Target is the peak-to-trough percentage value loss the adviser seeks to achieve for any period of portfolio downturn.
RiskAlign ® ranges are hypothetical projections based on statistical models and assumptions. They are not guarantees of future performance and actual results may differ materially.
See disclaimer at the end for more information.
For the period shown in the range, the model portfolios results have fallen within the RiskAlign ® ranges shown. However, these observations are based on hypothetical analysis
and do not indicate that future results will fall within these ranges. Actual outcomes may vary significantly and may fall outside the projected ranges, including the potential for loss of
principal.
Market Review
The third quarter of 2026 was a tug-of-war between rising economic risks and continued enthusiasm around artificial
intelligence. Renewed conflict between the U.S. and Iran sent oil prices higher, with Brent crude approaching
$107 per barrel, including an 18% jump in September alone. Higher energy costs put pressure on consumers
and businesses, but the ongoing AI investment boom helped support stocks and offset some of the uncertainty.
The bigger shakeup came from the bond market. The 10-year U.S. Treasury yield climbed above 5% for the first time
since 2007, pushing borrowing costs higher across the economy. Investors demanded higher yields as inflation remained
stubborn and U.S. government debt approached $40 trillion. For bondholders, the impact was immediate: as yields rose,
existing bond prices fell. While AI helped keep stocks resilient, rising interest rates became one of the biggest challenges
for investors this quarter.
Treasury Yields Return to 2007 Levels
7
6
10-Year Treasury Yield (%)
5
4
3
2
1
0
2000 2002 2004 2006 2008 2010 2012 2014 2016 2018 2020 2022 2024 2026
Source: Bloomberg, Redwood, Data as of 9/30/2026.
shrierassociates.com
Strategic
The third quarter was a tale of two markets. The S&P 500 gained 2.30% and the technology-heavy Nasdaq rose 2.61%,
while smaller companies, represented by the Russell 2000, fell 7.19%. Semiconductor stocks, among the year’s strongest
performers, stumbled in July and August as investors questioned whether massive AI spending would translate into
equally impressive profits. Despite the volatility, strength among the largest technology companies helped keep the major
indexes in positive territory.
Bond investors faced a tougher environment. In September, the Federal Reserve raised interest rates by a quarter of a
percentage point, its first increase since 2023. With inflation still above the Fed’s 2% target and the economy holding up,
investors began preparing for the possibility of additional hikes. That pushed bond yields higher and existing bond prices
lower, particularly for longer-term holdings.
Having a diversified approach toward different asset classes helped the strategic sleeve of Our Engineered Risk-
Budgeted (ERB) models perform in this fragmented market. The recent portfolio update in the ERB models also helped
reallocate some equity exposures that had performed well into other sleeves that are well positioned for the current
market environment. Within the strategic fixed-income sleeve, the rebalance swapped the long-term Treasury position for
a short-term Treasury holding, which is less sensitive to interest rate volatility.
Q3 Performance Attribution
Key contributors and detractors to portfolio performance during the quarter.
Strategic Equity Contributors Strategic Fixed-Income Contributors
STRATEGY RETURN
Large-Mid Cap Blend
LeaderShares® AlphaFactor® U.S. Core Equity
+2.83%
Large Cap Blend
Vanguard S&P 500 Index
+2.31%
No positive fixed-income contributors during this period.
Large Cap Blend
+0.56%
Invesco QQQ Trust Series 1
Developed International
+0.01%
iShares MSCI EAFE
Key Takeaway: Equity contributors reflected mega-cap tech resilience
and some broadening in market leadership beyond AI-focused names Strategic Fixed-Income Detractors
during the period. STRATEGY RETURN
Core Bond
iShares Core Total Bond
-3.41%
Core Bond
Strategic Equity Detractors LeaderShares® Dynamic Yield
-1.06%
STRATEGY RETURN Investment-Grade Bond
State Street SPDR Portfolio Short Term Treasury
-0.23%
Large Cap Blend
Invesco S&P 500 Momentum
-6.02%
Key Takeaway: All Fixed-income detractors were led by core bond
Key Takeaway: Momentum-oriented large-cap equity exposure exposure, as higher rates weighed most heavily on duration-sensitive
pulled back after extremely strong performance YTD. holdings.
Returns shown are for illustrative purposes and represent strategy-level performance based on model allocations or representative holdings. These results do not reflect actual client
account performance and do not include advisory fees, transaction costs, or taxes, which would reduce returns. Actual client results will vary.
shrierassociates.com
Defensive
Market risks continued to build throughout the third quarter. Renewed tensions in the Middle East, stubborn
inflation, and the possibility of further Fed rate hikes added uncertainty. At the same time, investors began questioning
whether the massive spending on AI would deliver the profits companies were expecting. With Treasury yields reaching
their highest levels in nearly two decades, both stocks and bonds faced growing pressure.
While the overall drawdown in risk assets was mild, the potential for a larger pullback in a stretched stock market, set
against an uncertain economic backdrop, moved some of our tactical models into a defensive stance. As a result, toward
the end of the third quarter, 3 of the 5 Defensive strategies moved into a risk-off position, reducing exposure to areas
more sensitive to market declines. Our Defensive strategies are designed to respond to changing market conditions rather
than predict them, allowing portfolios to reduce risk when uncertainty rises and return to a more invested position when
conditions improve.
Q3 Performance Attribution
STRATEGY STATUS RETURN
Tactical Domestic
Risk On -1.67%
LeaderShares® AlphaFactor® Tactical Focused
Tactical International
Risk Off +4.24%
Redwood AlphaFactor® Tactical International Fund
Tactical Diversified
Risk On +2.00%
Redwood Systematic Macro Trend (“SMaRT”)® Fund
Non-Traditional Bond / Tactical
Risk Off -1.88%
Redwood Managed Volatility Fund
Non-Traditional Bond / Tactical
Risk Off -5.84%
Redwood Managed Municipal Income Fund
Returns shown are for illustrative purposes and represent strategy-level performance based on model allocations or representative holdings. These results do not reflect actual client
account performance and do not include advisory fees, transaction costs, or taxes, which would reduce returns. Actual client results will vary.
shrierassociates.com
Private Real Estate Debt
Rising interest rates have created a difficult environment for traditional bonds, but not all fixed-income investments have
felt the same pressure. As Treasury yields climbed above 5%, investment-grade bonds and mortgage-backed securities
lost value. Our Private Real Estate Debt strategy has followed a different path. Its shorter-term loans are less sensitive
to interest-rate swings, helping the strategy deliver steadier returns while traditional bond markets struggled. As the chart
shows, this difference has become particularly noticeable in 2026.
Steady Income, Falling Rates
Total Return Since Inception of Redwood’s Private Real Estate Debt Strategy
Redwood Private Real Estate Debt Strategy Residential Mortgage-Backed Securities Investment-Grade Aggregate
30%
20%
10%
0%
-10%
6/2023 2/2024 10/2024 6/2025 2/2026 10/2026
Source: Bloomberg, Redwood. Data as of 9/30/2026. Investors should carefully consider the investment objectives, risks, charges and
expenses of the Redwood Private Real Estate Debt Fund.
The Redwood Private Real Estate Debt strategy ended the quarter with an annualized distribution of 7.03% while seeking
to maintain a stable daily net asset value (NAV), the per-share value of the fund. Its underlying holdings are private,
short-term loans backed by commercial real estate, which have historically shown low correlation with public markets.
As in prior quarters, its role is not to outperform stocks. Its role is to support the portfolio with current income and
capital preservation.
shrierassociates.com
RiskAlign® Disclosures:
The RiskAlign® Range is a projection outlook and forecast based on statistical models, assumptions, methodologies, and unquantifiable opinions that are subject to change.
The RiskAlign® Range is provided for information purposes only and reflects the views of Redwood as of the date of publication. It is intended to provide an overview
of potential portfolio outcomes and should not be construed as investment advice or a recommendation for any specific investment strategy or product. Any outlook and
projection has limitations due to unforeseen factors. These unforeseen factors can be external or internal financial market events.
As part of the calculation of the RiskAlign® Range, the following assumptions were made involving normal distribution and standard deviation, further explained hereafter. A
6-month rolling standard deviation is applied to historical returns of portfolio holdings. The bottom range number is the blended hypothetical model portfolio’s 6-year rolling
return mean, minus 2 standard deviations. The upper range number is the blended hypothetical model portfolio’s 6-year rolling return mean, plus 2 standard deviations.
Assuming a normal distribution, 95% of data points lie within 2 standard deviations about the mean. This does not imply a 95% probability of future portfolio returns. This does
not include the other 5% of data points that may fall significantly above and below the mean including a 100% loss of principal. The final RiskAlign® ranges may contain non-
quantifiable factors such as opinions of Redwood’s.
The RiskAlign® Range is forward-looking estimation and there may be no statistical efficacy. These projections are based on assumptions that involve risk and uncertainties
and are not guaranteed. Actual portfolio can experience significant differences including more loss or gain than shown. Individual holdings of a model portfolio may change
for the period. Actual future results will vary materially from those expressed or implied by RiskAlign® Ranges due to various factors including, but not limited to, changes in
economic conditions and market fluctuations.
The information above contains opinions and should not be construed as facts. There is no guarantee any investments will perform within the range. All investments involve
risks, including the possible loss of principal. The RiskAlign® Range does not consider the investment objectives, risk tolerance, or financial circumstances of any specific
investor and may not be suitable for all investors. The advisor does not guarantee the performance of any investment or the attainment of any specific investment goals.
RiskAlign® Ranges are hypothetical in nature and therefore do not reflect actual investment results and are not guarantees of future results. Hypothetical statistics do involve
financial risk and does not take into account that material and market factors may have impacted the adviser’s decision making if the adviser were actually managing client’s
money. Hypothetical statistics within this material include the reinvestment of dividends and other account earnings.
Also, investment strategies or objectives of the model portfolio may have changed over time and may change in the future. There is no guarantee that any portfolio will meet its
objective. Holdings utilized for the testing of the strategy are positions at the point in time of calculation, which may no longer be available or are no longer recommended by
the adviser. In fact, ongoing quantitative research can lead to changes in the parameters of the model in the adviser’s sole discretion. Selection of securities is not static, may
differ from account to account, and are subject to further change in the future. Any modifications to model portfolio constituents by an adviser will yield different range results
than those shown above. RiskAlign® is produced by Redwood Investment Management, LLC (“Redwood”).
General Disclosures:
The market commentary is for informational purposes only and should not be deemed as a solicitation to invest, or increase investments in Redwood Investment Management,
LLC (`Redwood’) products or affiliated products. The information contained herein is not intended to provide any investment advice or provide the basis for any investment
decisions. Please consult a qualified professional before making decisions about your financial situation. Information and commentary provided by Redwood are opinions
and should not be construed as facts. There can be no guarantee that any of the described objectives can be achieved. Past performance is not a guarantee of future
results. Redwood does not make any representation that any strategy will or is likely to achieve returns similar to those shown in the performance results in this presentation.
Diversification of asset class or investment style does not guarantee against loss or out performance. Different types of investments involve varying degrees of risk and
there can be no assurance that any specific investment will be profitable. The price of any investment may rise or fall due to changes in the broad markets or changes in a
company’s financial condition and may do so unpredictably. Any individual securities shown are not a recommendation to buy or sell. Any funds shown will have different
investment objectives and strategies and are for illustration purposes only and is not a statement of equal comparisons. Information provided herein from third parties is
obtained from sources believed to be reliable, but no representation or warranty is made as to its accuracy or completeness. This material is strictly for illustrative, educational,
and informational purposes and is subject to change without notice. This material contains opinions that should not be construed as facts and that are subject to change
without notice. The information and opinions contained in this material are derived from proprietary and non proprietary sources deemed by Redwood to be reliable and are
not necessarily all-inclusive and are not guaranteed as to accuracy and are subject to change without notice.
Indices are shown for informational purposes only; it is important to note that Redwood’s strategies differ from the indices displayed and should not be used as a benchmark
for comparison to account performance. While the indices chosen to represent broad market performance of each asset class, there are report limitations as to available
indices and blends, which index can be selected, and how they are presented. An investor cannot invest directly in an index. Unless otherwise noted, index returns reflect
the reinvestment of income dividends and capital gains, if any, but do not reflect fees, brokerage commissions or other expenses of investing. Investors cannot make direct
investments into any index.
Investment advisory services offered through Shrier Associates LLC, an investment advisor representative. The firm only transacts in states in which it is properly
registered or exempt. Shrier Associates LLC, and Redwood are not affiliated entities. Such registration does not imply a certain level of skill or training and no inference to
the contrary should be made. Advisory fees and risks are fully detailed in Part 2A of its Form ADV, available upon request. This material may not be published, broadcast,
rewritten or redistributed in whole or part without express written permission. RiskFirst ®® is a registered trademark of Redwood.
Definitions:
The S&P 500 is an unmanaged index of 500 large-cap U.S. companies, which seeks to measure the U.S. stock market and is based on the market capitalization of 500
leading companies publicly traded in the U.S. as determined by Standard and Poor’s. Nasdaq is a market capitalization weighted index comprised of approximately 3,000
common equities listed on the NASDAQ stock exchange. Russell 2000 is an index that measures the performance of the small-cap segment of the U.S. equity universe,
including approximately 2000 of the smallest securities based on a combination of their market cap and current index membership.
shrierassociates.com
Contact Us
Shrier Associates LLC
619 Devenwood Way, Clinton, MA 01510
5 Farleigh St. Suite 305, Asheville, NC 28803
508.898.9500 | shrierassociates.com
Explore our investment philosophy or contact our team to discuss your own circumstances.
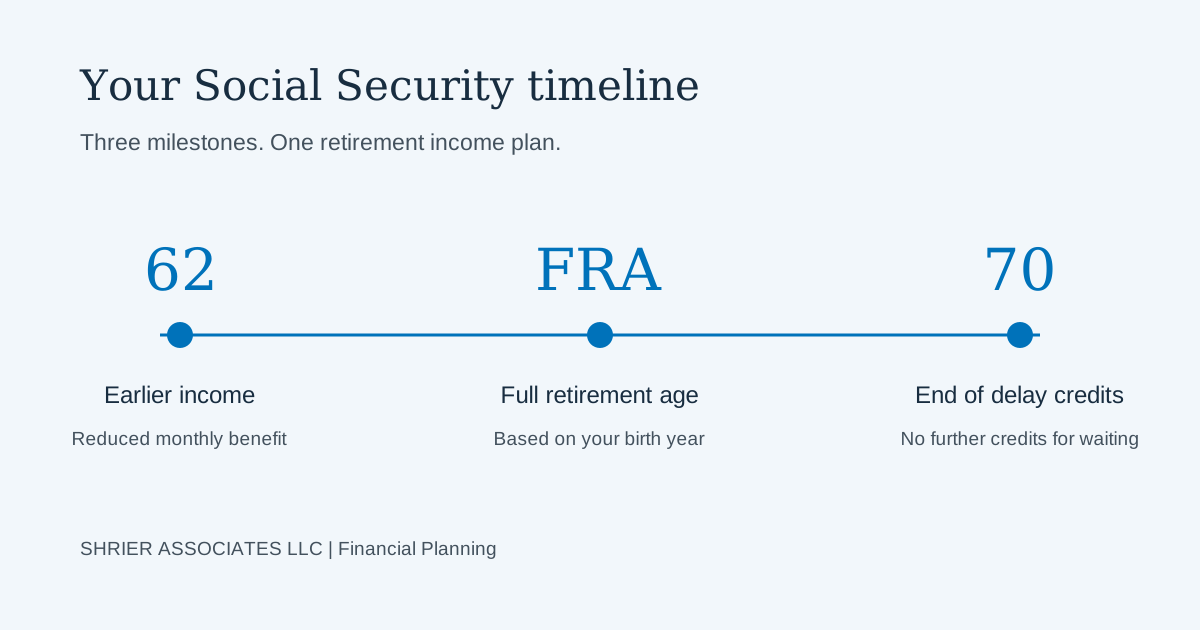
Explore Social Security claiming ages, work, taxes, and family benefits, with practical takeaways from our Social Security presentation.
Read Article →
Organize your spending, income, healthcare questions, and investment decisions before you make the transition to retirement.
Read Article →