


Q2 2026 market review and ERB portfolio commentary on strategic investments, defensive strategies, private real estate debt, and RiskFirst®.
Read the complete six-page ERB portfolio report below, including all charts, performance information, and important disclosures. For larger text and zoom controls, open the original PDF.
Open Full Commentary (PDF)ERB Portfolio Q2 2026
Quarterly Commentary
Market Review
The second quarter of 2026 marked a sharp reversal from the volatility of the prior period. As an initial ceasefire
in the Iran conflict took hold, concerns about potential oil-supply disruptions began to ease, and equity markets
rebounded. The S&P 500 gained 15.2% during the quarter, while the Nasdaq Composite rose 21.6%, marking the
strongest quarterly advance for both indices since 2020.
The strength of the rebound, however, was narrowly concentrated. Companies tied to energy and artificial
intelligence, shown in dark grey and light grey in the chart below, accounted for most of the market’s gains, while
the rest of the S&P 500, shown in the blue bars, spent much of Q2 in negative territory. Resilience among AI-related
companies was a major driver, helping the index add over $6 trillion in market capitalization during the quarter.
Excluding AI and energy, however, the broader index would have ended the period almost flat. The result was a
powerful headline rally led by a relatively small group of companies.
AI and Energy Do the Heavy Lifting
Change In Market Cap Since Jan. 1, 2026
10000 S&P 500 S&P Energy S&P AI S&P Excluding Energy and AI
YTD Change in Market Cap ($ Billions)
5000
0
-5000
Jan-2026 Feb-2026 Mar-2026 Apr-2026 May-2026 Jun-2026
Source: Bloomberg, Redwood. Data as of 6/30/2026.
shrierassociates.com
Strategic
Fundamentally, corporate earnings remained resilient in Q2, coming in 16% above consensus estimates, the
largest aggregate beat of the post-COVID era. The defining force behind the rally was the continued buildout of
artificial intelligence infrastructure. Investors moved beyond the broad AI narrative and focused on the companies
supplying the underlying hardware, including semiconductors, memory, networking, and data center capacity.
That shift favored U.S. large-cap equities, particularly the momentum factor, which held greater exposure to the
hardware companies leading the advance.
In fixed-income, rates became a central focus as Kevin Warsh succeeded Jerome Powell as Fed Chair and market
expectations shifted from a more accommodative outlook in April to a more hawkish stance by June. Even so,
the Federal Reserve held rates steady throughout the quarter, helping core bonds generate positive returns and
perform broadly in line with expectations.
This is where the strategic portion of our Engineered Risk-Budgeted (ERB) models proved its value. At the most
recent reconstitution (September 2025), the models increased market exposure, including AI-related holdings,
as the portfolios’ risk budgets allowed. That positioning helped capture the rally as it unfolded. Even as gains
remained concentrated, the strategic allocation stayed diversified across factors, styles, and asset classes,
reducing reliance on any single source of return while participating meaningfully in the upside.
Q2 Performance Attribution
Key contributors and detractors to portfolio performance during the second quarter.
Strategic Equity Contributors Strategic Fixed-Income Contributors
STRATEGY RETURN STRATEGY RETURN
Large Cap Equities Core Bond
+27.73% +0.95%
Invesco QQQ Trust Series 1 iShares Core Universal USD Bond ETF
Large Cap Equities Investment-Grade Bond
+44.31% +0.80%
Invesco S&P 500 Momentum SPDR Portfolio Long Term Treasury
Core Bond
+0.98%
LeaderShares® Dynamic Yield
Key Takeaway: Artificial intelligence leadership and mega-cap growth Key Takeaway: Core bond positions all generated positive returns
concentration drove outsized gains, making Nasdaq 100 and S&P during the quarter, supported by stable credit spreads and
Momentum the strongest equity contributors during the quarter. constructive fixed-income market conditions.
Strategic Equity Detractors Strategic Fixed-Income Detractors
STRATEGY RETURN
Large Cap Equities Key Takeaway: All bond positions performed similarly during the
+15.27%
Vanguard S&P 500 Index quarter, with stable credit spreads limiting any meaningful fixed-
income detractors.
Developed International
+8.63%
iShares MSCI EAFE
Returns shown are for illustrative purposes and represent strategy-level
Large-Mid Cap Blend performance based on model allocations or representative holdings. These results
+12.83% do not reflect actual client account performance and do not include advisory fees,
LeaderShares® AlphaFactor® U.S. Core Equity
transaction costs, or taxes, which would reduce returns. Actual client results will
vary.
Key Takeaway: These allocations still produced strong absolute gains,
but they lagged the quarter’s more concentrated AI- and momentum-
driven equity exposures.
shrierassociates.com
Defensive
As volatility subsided and equity trends recovered, the Defensive strategies that entered Q2 in risk-off positions
shifted back to fully invested positions. Those strategies had reduced exposure during Q1’s selloff as market
volatility increased; when conditions improved, the process reversed course. By quarter-end, all Defensive
strategies were fully invested, allowing them to participate in the rebound while preserving the flexibility to respond
if trends weakened again.
Even with the rally, the underlying backdrop remained uneven. Consumer sentiment, a measure of how households
feel about the economy, fell to its lowest level of the year even as major equity indices reached record highs. At
the same time, energy prices tied to the Iran conflict pushed the Consumer Price Index to a 4.2% annual rate, its
highest reading since 2023. That shift effectively ended the easing cycle and moved market attention toward the
possibility of future rate hikes. Our Defensive strategies are designed to respond to these changes rather than
predict them. They ended Q2 fully invested, but remain prepared to reduce exposure again if weakening economic
conditions begin to show up in market trends.
Q2 Performance Attribution
Currently Invested Strategies
STRATEGY STATUS RETURN
Tactical Domestic
Fully Invested +13.43%
LeaderShares® AlphaFactor® Tactical Focused
Diversified
Fully Invested +6.66%
Redwood Systematic Macro Trend (“SMarT”)®
Non-Traditional Bond / Tactical
Redwood Managed Volatility
Fully Invested +1.94%
Tactical International
Redwood AlphaFactor® Tactical International
Fully Invested +2.55%
Non-Traditional Bond / Tactical
Redwood Managed Municipal Income
Fully Invested +0.70%
Currently Defensive Strategies
STRATEGY STATUS RETURN
No Current Defensive Positions N/A N/A
shrierassociates.com
Private Real Estate Debt
Our allocation to Private Real Estate Debt continued to do what it is designed to do: provide a steady source of
income away from the day-to-day volatility of public markets. Concerns that emerged in parts of private credit
during the quarter were concentrated largely in direct lending to software and technology companies, a different
segment of the market. Commercial real estate debt was largely unaffected. While the sleeve is not immune to risk,
that distinction helped it remain a consistent contributor to portfolio results in Q2.
Steady Income, Falling Rates
Redwood Private Real Estate Debt Distribution Rate 3-Month SOFR Fed Fund Rate
Source: Bloomberg, Redwood. Data as of 7/14/2026. For illustrative purposes only. Date range 6/23/2023 - 7/14/2026. Distribution Rate is calculated as the distribution for a
given month, multiplied by 12 (number of months in year) and divided by the v per share on 7/14/2026. Historical distributions have been derived solely by income from holdings
in the fund. Depending on when an investor purchased their shares, the annualized distribution rate may be higher or lower. There is no guarantee that investors will receive a
distribution or if source characteristics will remain the same. Past Performance is not indicative of future results.
The sleeve ended the quarter with an annualized distribution of 7.14%, maintaining a premium over cash and public
bonds of similar duration and credit quality. Since inception, that premium has held even as the Federal Funds Rate
and cash-equivalent yields like SOFR have fallen sharply. That income remained valuable even as public equities
rallied sharply. Private Real Estate Debt is not expected to outperform strong stock markets; that is not its role. Its
role is to support the portfolio with current income and capital preservation, and in Q2, it continued to deliver on
that mandate.
Q2 Performance Attribution
Private Markets
STRATEGY RETURN
Private Real Estate Debt Key Takeaway: Private real estate debt provided premium income
+1.57%
Redwood Private Real Estate Debt relative to cash and core investment-grade bonds during the quarter.
shrierassociates.com
Why Process Matters
More Than Prediction
The sharp reversal from Q1’s volatility to Q2’s rally illustrates why process matters more than prediction. Rather
than trying to forecast the next market move, our RiskFirst ® Process is designed to keep portfolios on track across
environments. Within this framework, the strategic, defensive, and private real estate debt sleeves each have a
defined role, allowing different parts of the portfolio to respond as conditions change.
This discipline matters in strong markets just as much as in difficult ones. As the broad rally lifted performance,
each model remained within its RiskAlign® range for the period and finished toward the higher end. That is the
process working as intended: participating meaningfully in the upside while staying anchored to the portfolio’s
designed risk profile rather than reaching for more. By maintaining that discipline, we remain on track toward long-
term objectives regardless of the next quarter’s headlines.
RiskAlign® Ranges
ERB 5-8 Within Range Range ERB 8-12 Within Range Range
5-8% Drawdown Target 8-12% Drawdown Target
-8.5% 0% +10.6% -9.3% 0% +12.2%
ERB 12-17 Within Range Range ERB 17-25 Within Range Range
12-17% Drawdown Target 17-25% Drawdown Target
-10.6% 0% +14.9% -12.5% 0% +18.2%
ERB 25-35 Within Range Range
25-35% Drawdown Target
6 Month RiskAlign®®®® Expected Returns
(As of 12/31/2025)
-14.0% 0% +20.8%
Source: Redwood. For illustrative purposes only. Drawdown Target is the peak-to-trough percentage value loss the adviser seeks to achieve for any period of portfolio
downturn. RiskAlign ® ranges are hypothetical projections based on statistical models and assumptions. They are not guarantees of future performance and actual
results may differ materially. See disclaimer at the end for more information.
For the period shown in the range, the model portfolios results have fallen within the RiskAlign ® ranges shown. However, these observations are based on hypothetical
analysis and do not indicate that future results will fall within these ranges. Actual outcomes may vary significantly and may fall outside the projected ranges, including the
potential for loss of principal.
shrierassociates.com
Important Disclosures:
The RiskAlign ® Range is a projection outlook and forecast based on statistical models, assumptions, methodologies, and unquantifiable opinions that are subject to
change. The RiskAlign ® Range is provided for information purposes only and reflects the views of Redwood as of the date of publication. It is intended to provide an
overview of potential portfolio outcomes and should not be construed as investment advice or a recommendation for any specific investment strategy or product. Any
outlook and projection has limitations due to unforeseen factors. These unforeseen factors can be external or internal financial market events.
As part of the calculation of the RiskAlign ® Range, the following assumptions were made involving normal distribution and standard deviation, further explained
hereafter. A 6-month rolling standard deviation is applied to historical returns of portfolio holdings. The bottom range number is the blended hypothetical model portfolio’s
6-year rolling return mean, minus 2 standard deviations. The upper range number is the blended hypothetical model portfolio’s 6-year rolling return mean, plus 2 standard
deviations. Assuming a normal distribution, 95% of data points lie within 2 standard deviations about the mean. This does not imply a 95% probability of future portfolio
returns. This does not include the other 5% of data points that may fall significantly above and below the mean including a 100% loss of principal. The final RiskAlign ®
ranges may contain non-quantifiable factors such as opinions of Redwood’s.
The RiskAlign ® Range is forward-looking estimation and there may be no statistical efficacy. These projections are based on assumptions that involve risk and
uncertainties and are not guaranteed. Actual portfolio can experience significant differences including more loss or gain than shown. Individual holdings of a model
portfolio may change for the period. Actual future results will vary materially from those expressed or implied by RiskAlign ® Ranges due to various factors including, but
not limited to, changes in economic conditions and market fluctuations.
The information above contains opinions and should not be construed as facts. There is no guarantee any investments will perform within the range. All investments
involve risks, including the possible loss of principal. The RiskAlign ® Range does not consider the investment objectives, risk tolerance, or financial circumstances of any
specific investor and may not be suitable for all investors. The advisor does not guarantee the performance of any investment or the attainment of any specific investment
goals.
RiskAlign ® Ranges are hypothetical in nature and therefore do not reflect actual investment results and are not guarantees of future results. Hypothetical statistics
do involve financial risk and does not take into account that material and market factors may have impacted the adviser’s decision making if the adviser were actually
managing client’s money. Hypothetical statistics within this material include the reinvestment of dividends and other account earnings.
Also, investment strategies or objectives of the model portfolio may have changed over time and may change in the future. There is no guarantee that any portfolio
will meet its objective. Holdings utilized for the testing of the strategy are positions at the point in time of calculation, which may no longer be available or are no longer
recommended by the adviser. In fact, ongoing quantitative research can lead to changes in the parameters of the model in the adviser’s sole discretion. Selection of
securities is not static, may differ from account to account, and are subject to further change in the future. Any modifications to model portfolio constituents by an adviser
will yield different range results than those shown above.
For illustration purposes only. Performance results shown do not reflect the deduction of advisory fees. If such fees were included, returns would be lower. Please
refer to Form ADV Part 2A for additional information regarding fees. All statements are opinions and should not be construed as facts. This presentation is for
informational purposes only and should not be deemed as a solicitation to invest, or increase investments in any products or affiliated products. The information
contained herein is not intended to provide any investment advice or provide the basis for any investment decisions. Please consult a qualified professional before
making decisions about your financial situation. Investing involves risk, including the potential loss of principal. No investment strategy can guarantee a profit or
protect against loss in periods of declining values. Information and commentary provided by are opinions and should not be construed as facts. There can be no
guarantee that any of the described objectives can be achieved. No claims are being made that asset class or strategy diversification will eliminate portfolio loss.
Information provided herein from third parties is obtained from sources believed to be reliable, but no reservation or warranty is made as to its accuracy or
completeness. Maximum Drawdown of blended indices are shown for informational purposes only; it is important to note that strategies differ from the indices
displayed and should not be used as a benchmark for comparison to account performance. While the indices chosen represent broad market performance of each
asset class, there are report limitations as to available indices and blends, which index can be selected, and how they are presented. The S&P 500 Index seeks to
measure the U.S. stock market and is based on the market capitalization of 500 leading companies publicly traded in the U.S. as determined by Standard & Poor’s.
The Barclays U.S. Aggregate Bond Index seeks to measure the investment grade, U.S. fixed-rate taxable bond markets. RiskFirst ®® is a registered trademark
of Redwood.
Investment advisory services offered through Shrier Associates LLC, a state registered investment adviser. The firm only transacts in states in which it is properly
registered or exempt. Shrier Associates LLC, and Redwood are not affiliated entities. Such registration does not imply a certain level of skill or training and no inference to
the contrary should be made. Advisory fees and risks are fully detailed in Part 2A of its Form ADV, available upon request. This material may not be published, broadcast,
rewritten or redistributed in whole or part without express written permission.
Definitions:
The S&P 500 is an unmanaged index of 500 large-cap U.S. companies, which seeks to measure the U.S. stock market and is based on the market capitalization of 500
leading companies publicly traded in the U.S. as determined by Standard and Poor’s. S&P Energy and S&P AI are sector subsets of the S&P 500 companies.
shrierassociates.com
Explore our investment philosophy or contact our team to discuss your own circumstances.
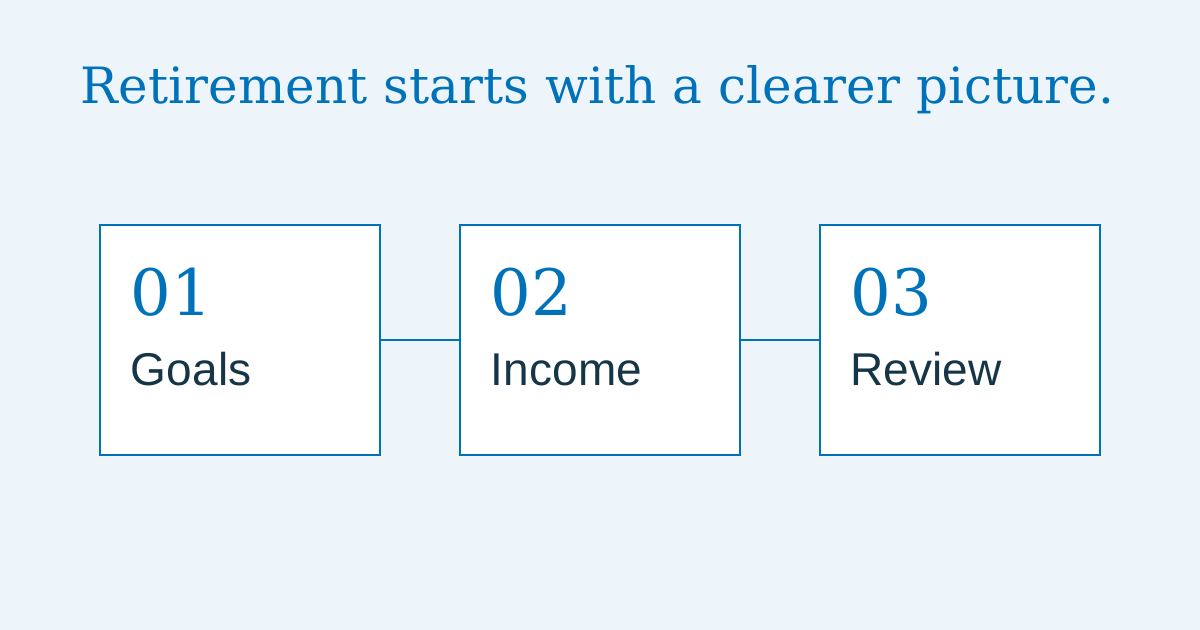
Organize your spending, income, healthcare questions, and investment decisions before you make the transition to retirement.
Read Article →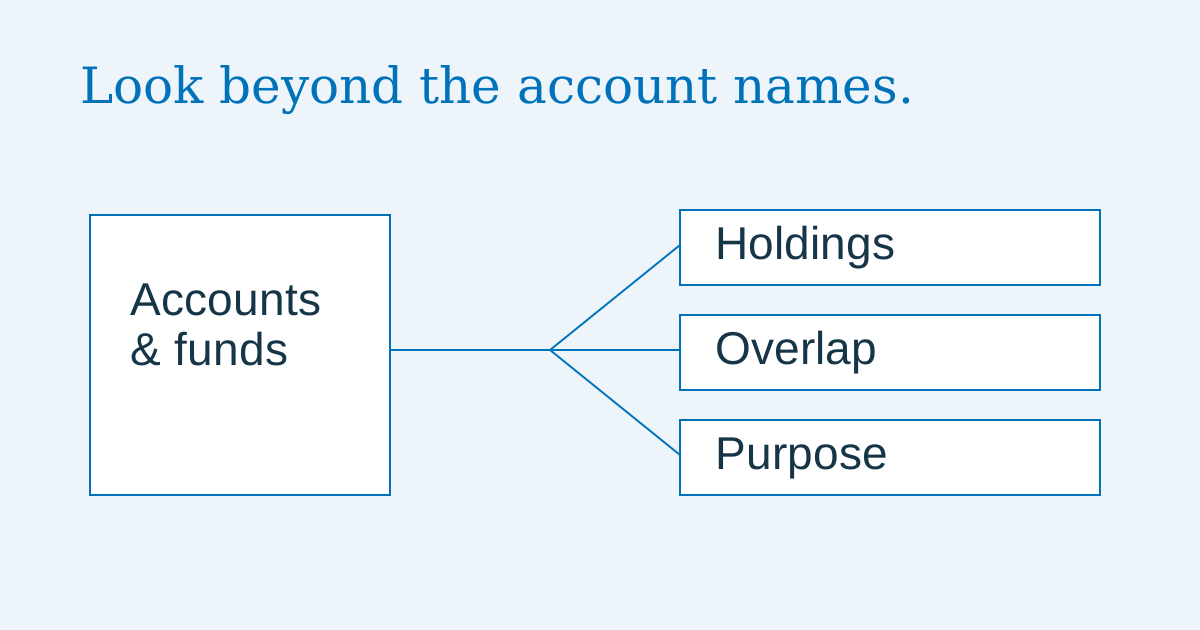
A step-by-step way to understand overlapping holdings, concentration, costs, and the role each investment plays in your plan.
Read Article →